Nsound Generators
Note
These examples use a small sample rate (between 100 and 1000) to keep the generation of this documentation relitively quick. In practice, higher quality sample rates should be used (44100, 48000, 96000 etc.).
The Generator Draw Routines
All Nsound Generators include basic drawing functions. Some basic Generator function documentation:
- Generator(sample_rate)
- Generator.drawDecay(duration, alpha=2.0*\pi)
- Generator.drawLine(duration, y1, y2)
- Generator.drawGaussian(duration, mu, sigma, normalize=True)
- Generator.drawFatGaussian(duration, pass_band_percent=0.01)
- Generator.drawParabola(duration, y1, x2, y2, y3)
- Generator.drawSine(duration, frequency)
- Generator.drawSine2(duration, frequency, phase)
- Generator.drawWindow(duration, window_type)
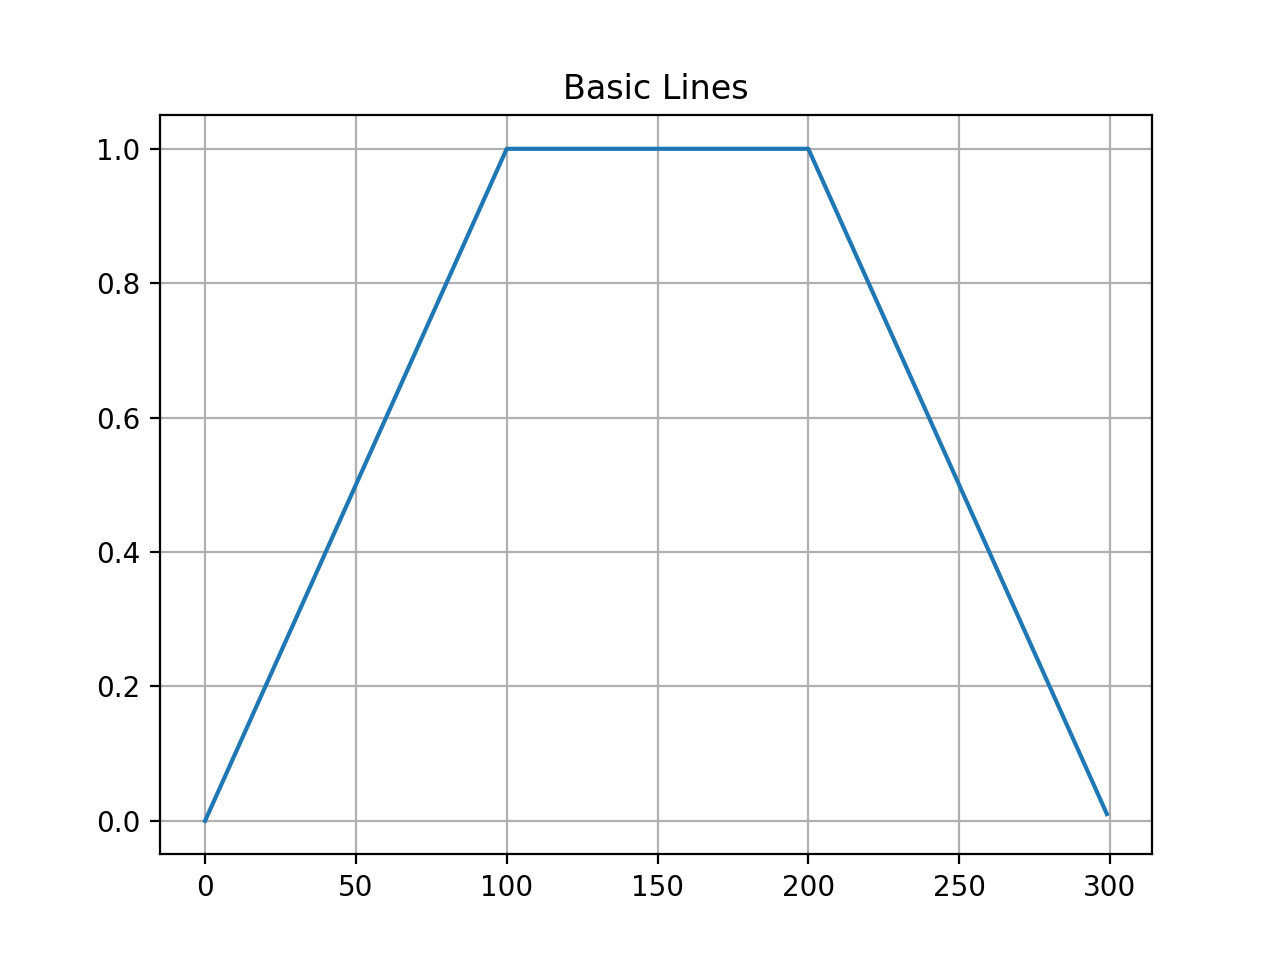
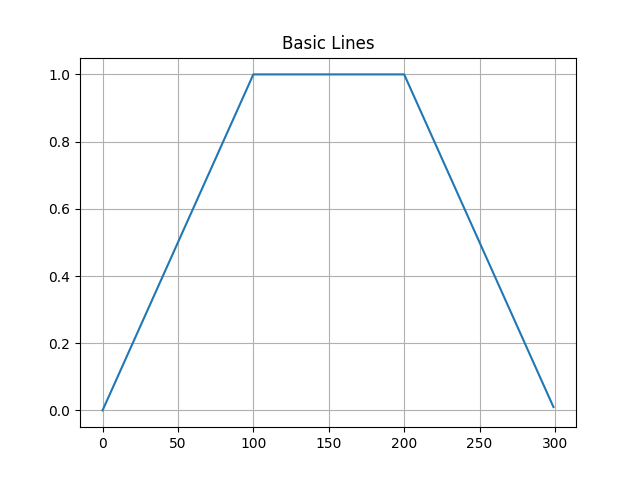
Drawing lines:
import Nsound as ns

g = ns.Generator(100.0)

b = ns.Buffer()
b << g.drawLine(1.0, 0.0, 1.0)
b << g.drawLine(1.0, 1.0, 1.0)
b << g.drawLine(1.0, 1.0, 0.0)

b.plot("Basic Lines")
(Source code, png, hires.png, pdf)
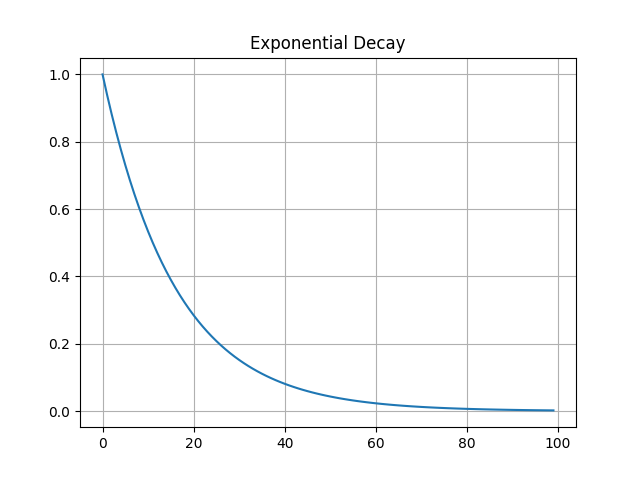
Drawing a decaying curve:
import Nsound as ns

g = ns.Generator(100.0)

b = ns.Buffer()
b << g.drawDecay(1.0)

b.plot("Exponential Decay")
(Source code, png, hires.png, pdf)

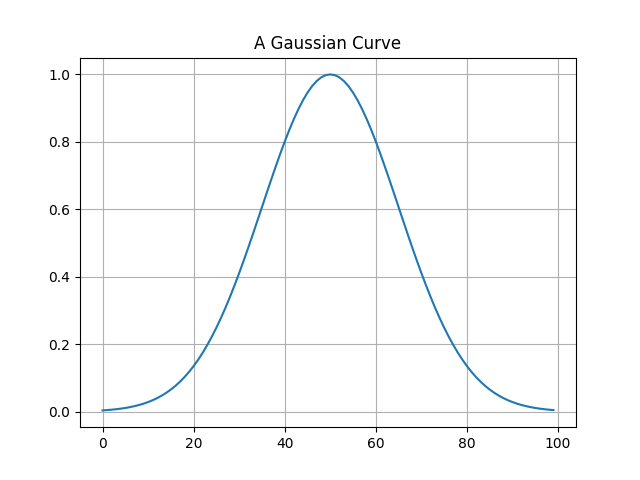
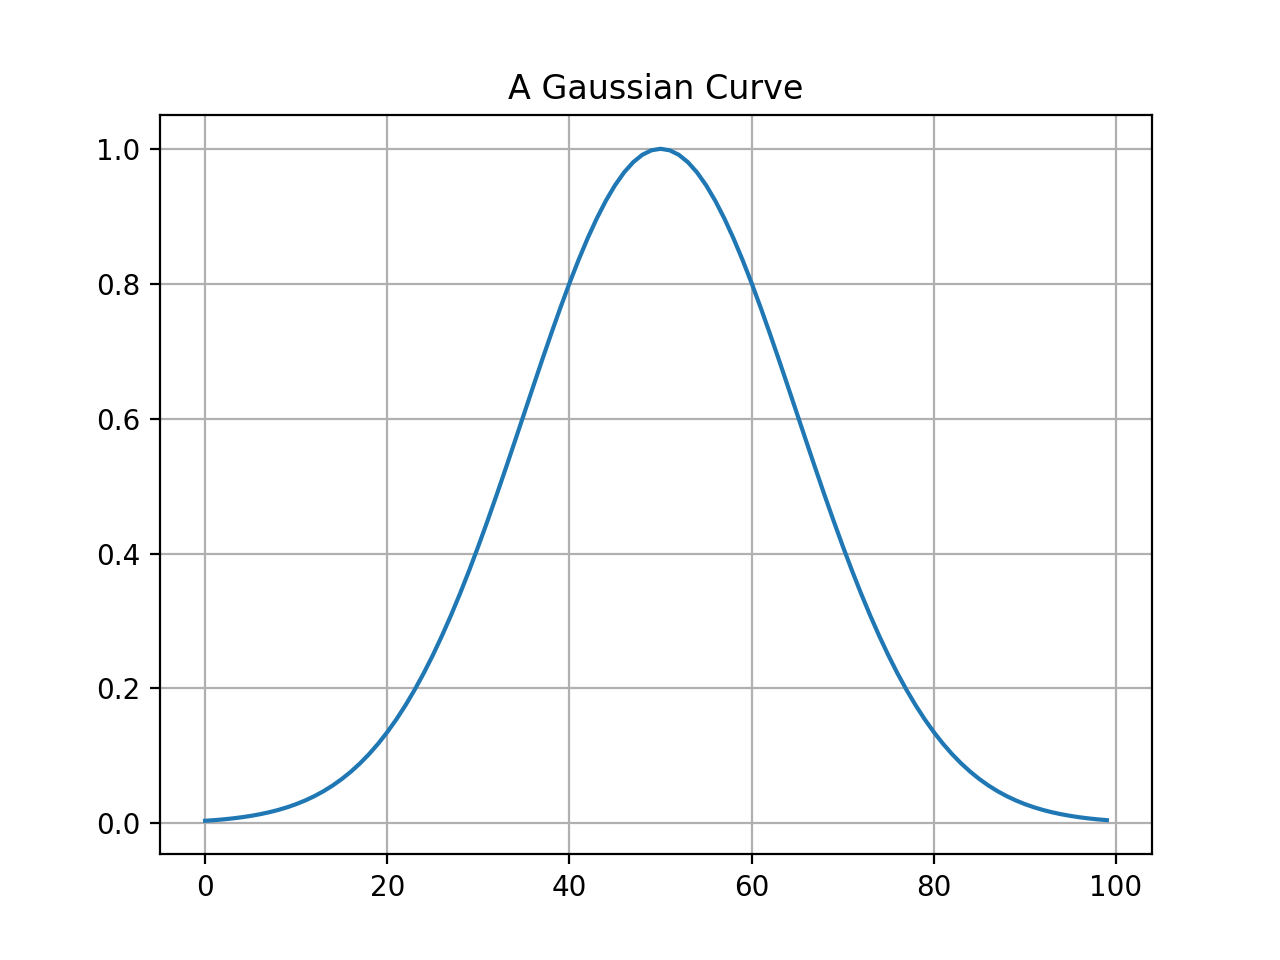
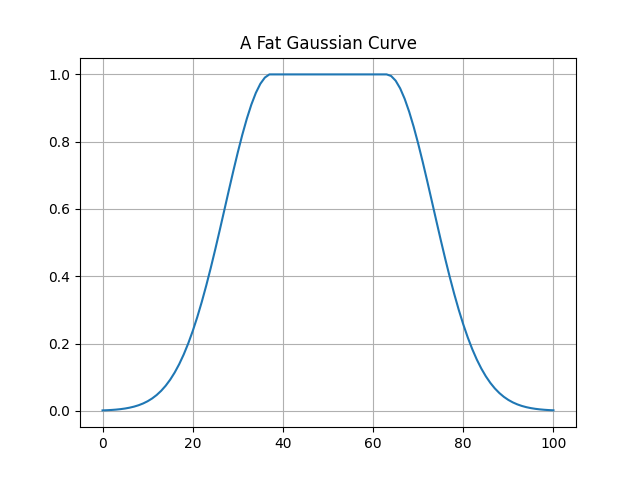
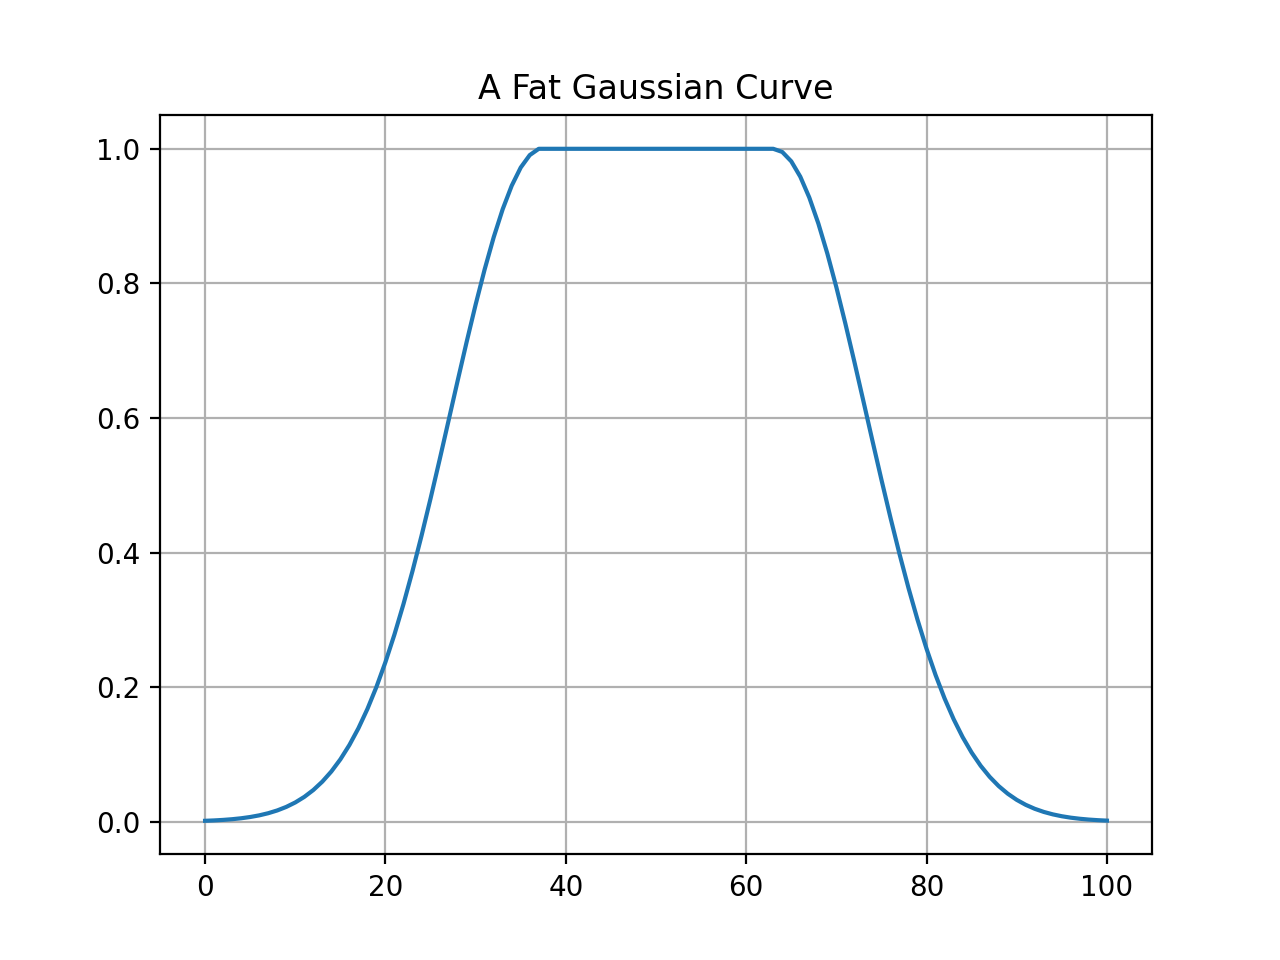
Drawing Gaussians:
import Nsound as ns

g = ns.Generator(100.0)

b = ns.Buffer()
b << g.drawGaussian(1.0, 0.5, 0.15)

b.plot("A Gaussian Curve")

b2 = ns.Buffer()
b2 << g.drawFatGaussian(1.0, 0.25)

b2.plot("A Fat Gaussian Curve")

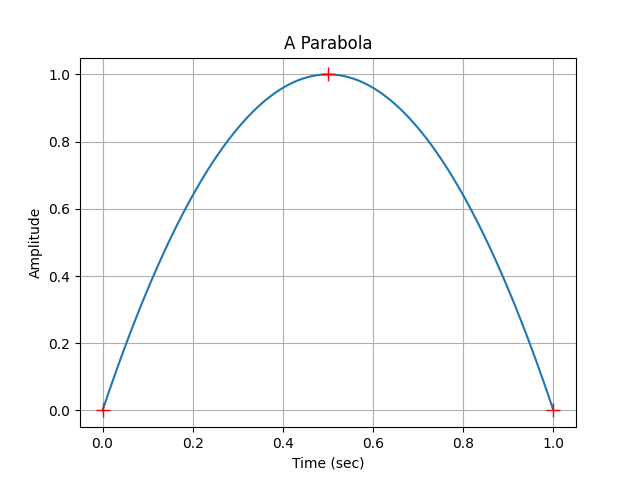
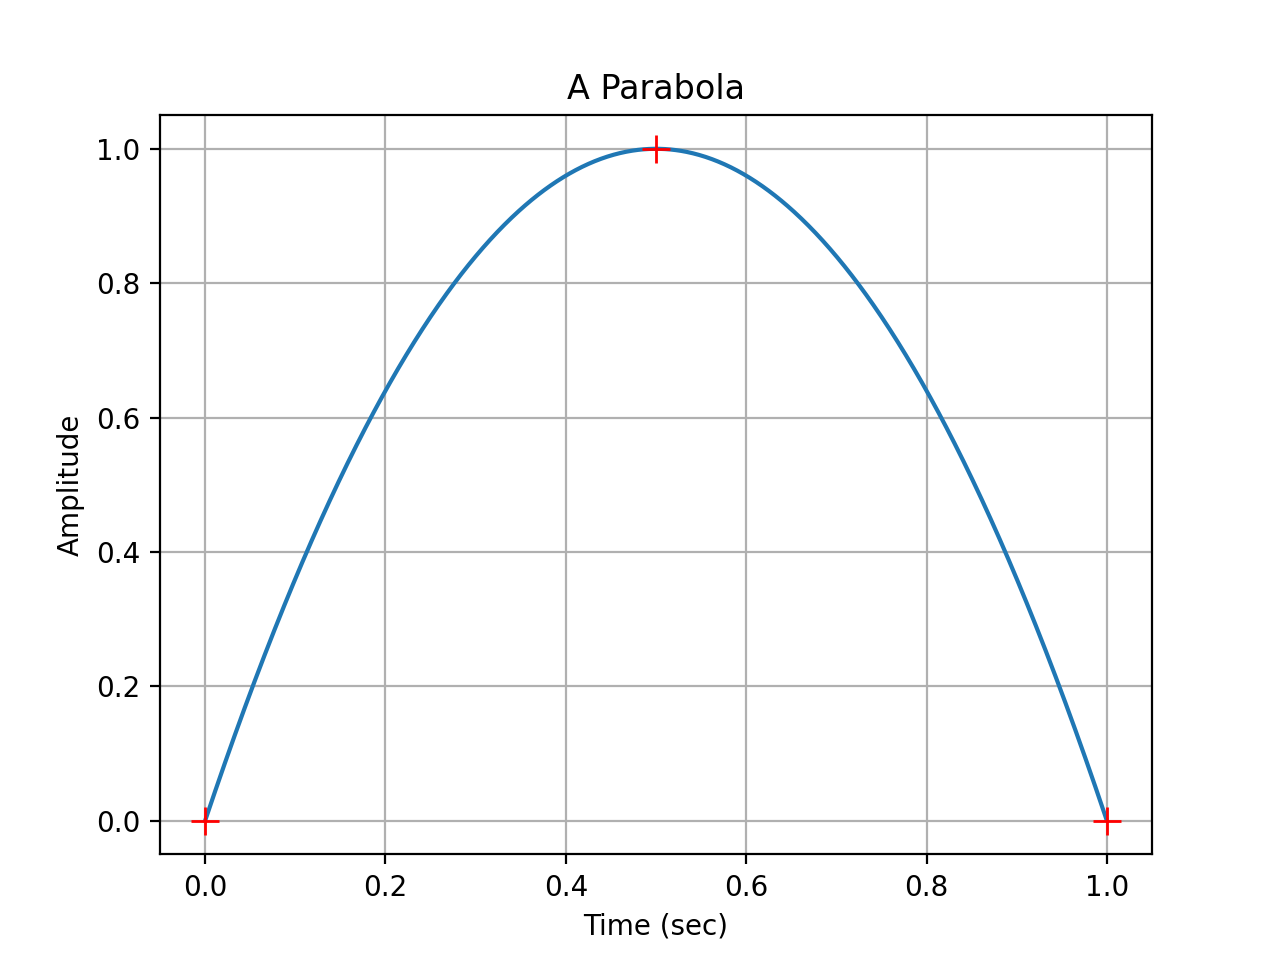
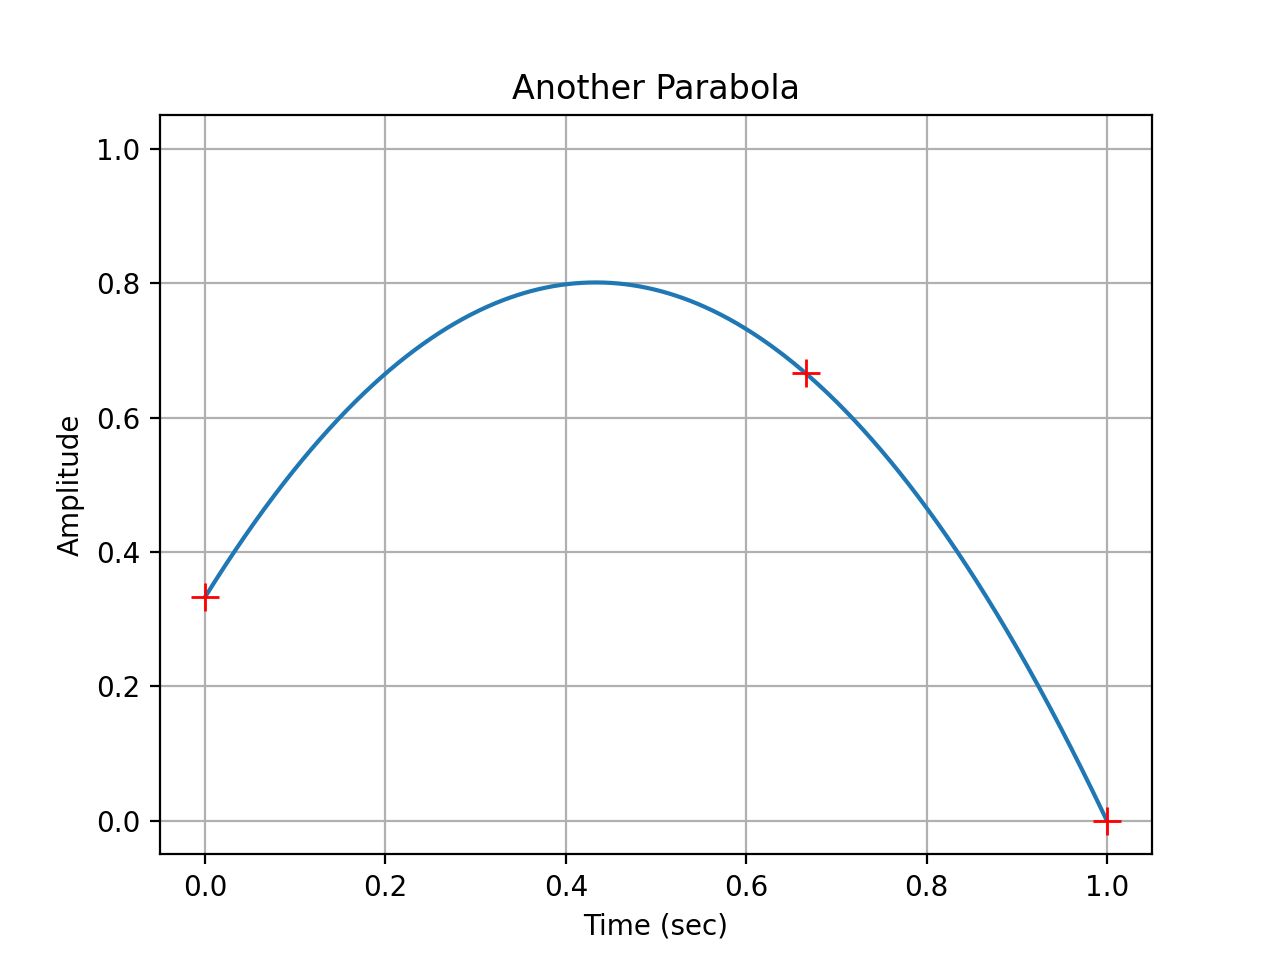
Drawing parabolas, note that an AudioStream is used so the x axis has the units of seconds:
import Nsound as ns

from matplotlib import pylab

sr = 1000.0

g = ns.Generator(sr)

###########################################################################
# First Parabola

a = ns.AudioStream(sr, 1)
a << g.drawParabola(1.0, 0.0, 0.5, 1.0, 0.0)

a.plot("A Parabola")

# Plot red cross hairs at the three points
pylab.plot(
    [0.0, 0.5, 1.0],
    [0.0, 1.0, 0.0],
    "r+", markersize = 10.0)

pylab.xlim(-0.05, 1.05)
pylab.ylim(-0.05, 1.05)

###########################################################################
# Seconds Parabola

a = ns.AudioStream(sr, 1)
a << g.drawParabola(1.0, 0.333, 0.666, 0.666, 0.0)

a.plot("Another Parabola")

# Plot red cross hairs at the three points
pylab.plot(
    [0.000, 0.666, 1.000],
    [0.333, 0.666, 0.000],
    "r+", markersize = 10.0)

pylab.xlim(-0.05, 1.05)
pylab.ylim(-0.05, 1.05)


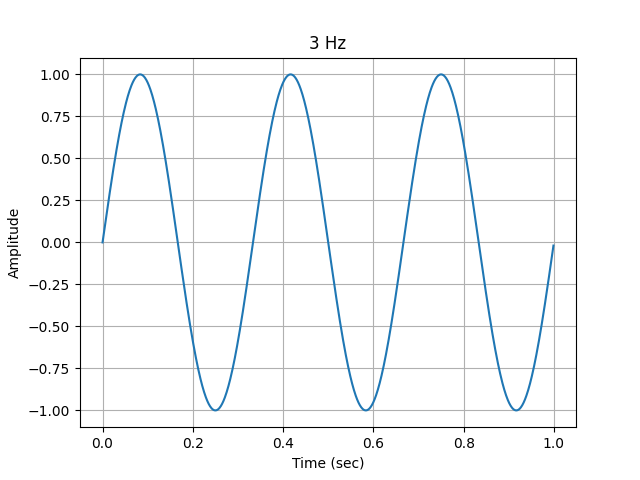
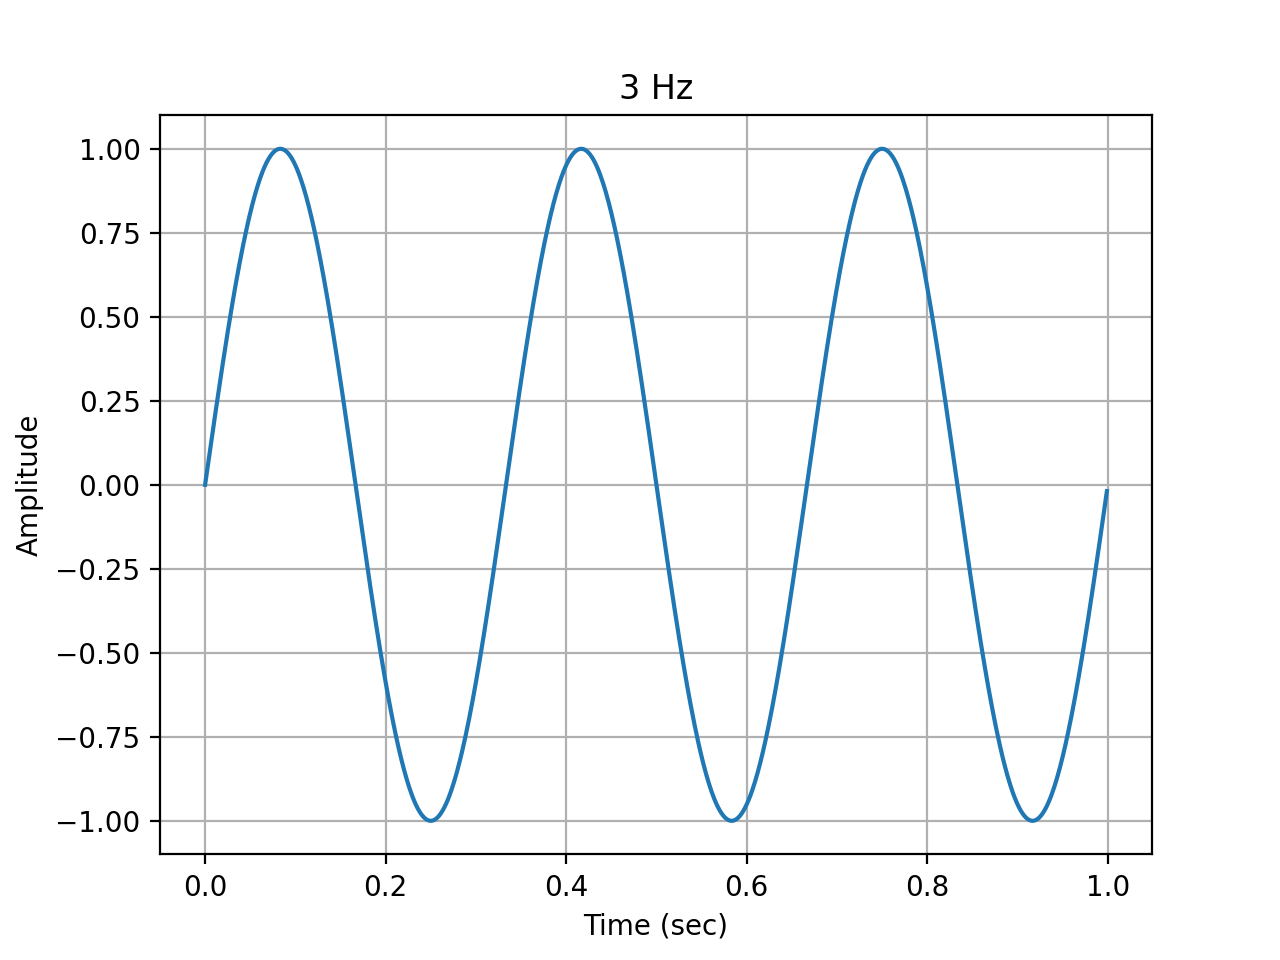
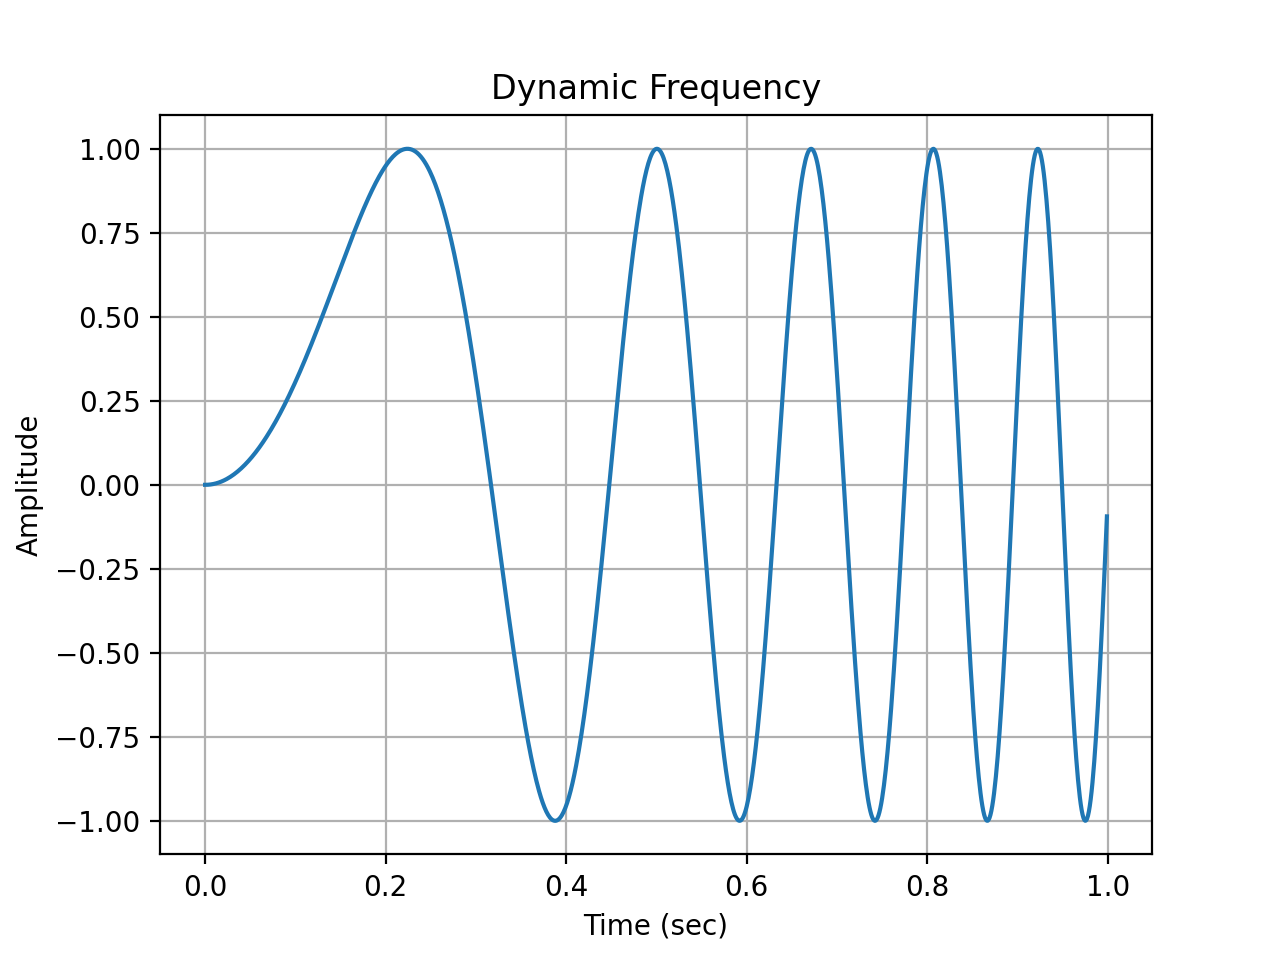
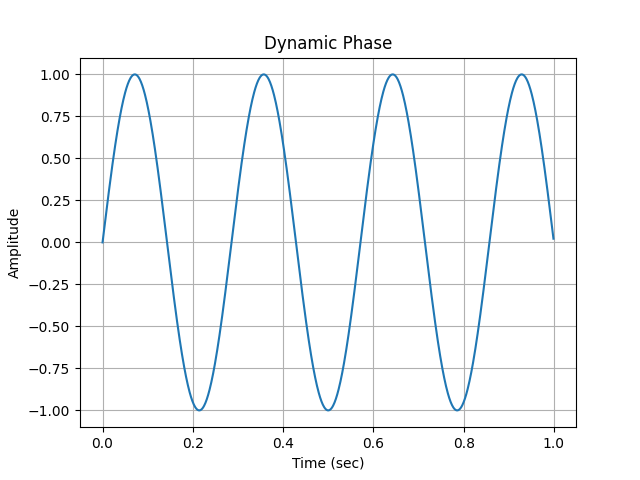
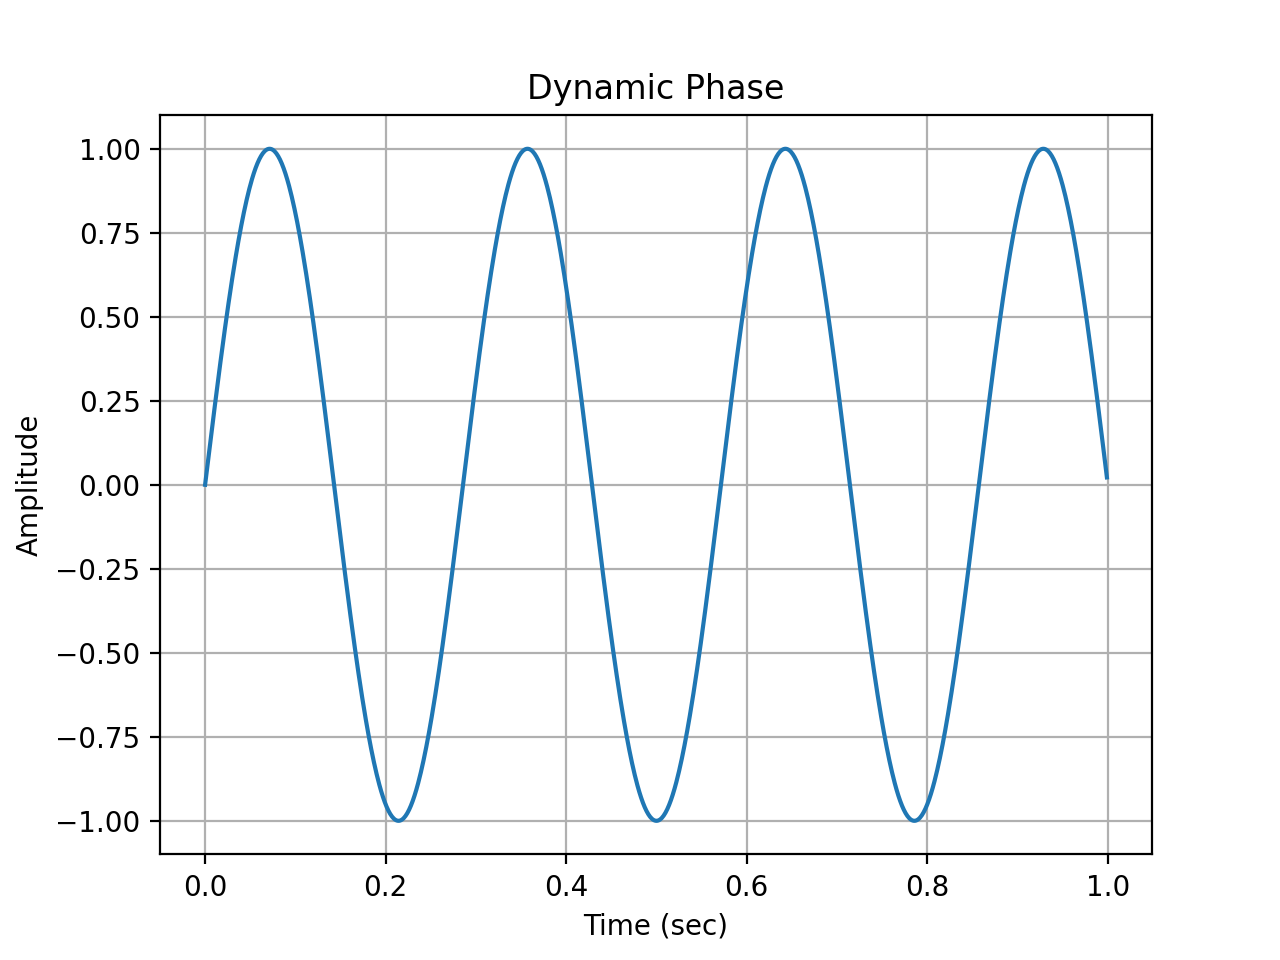
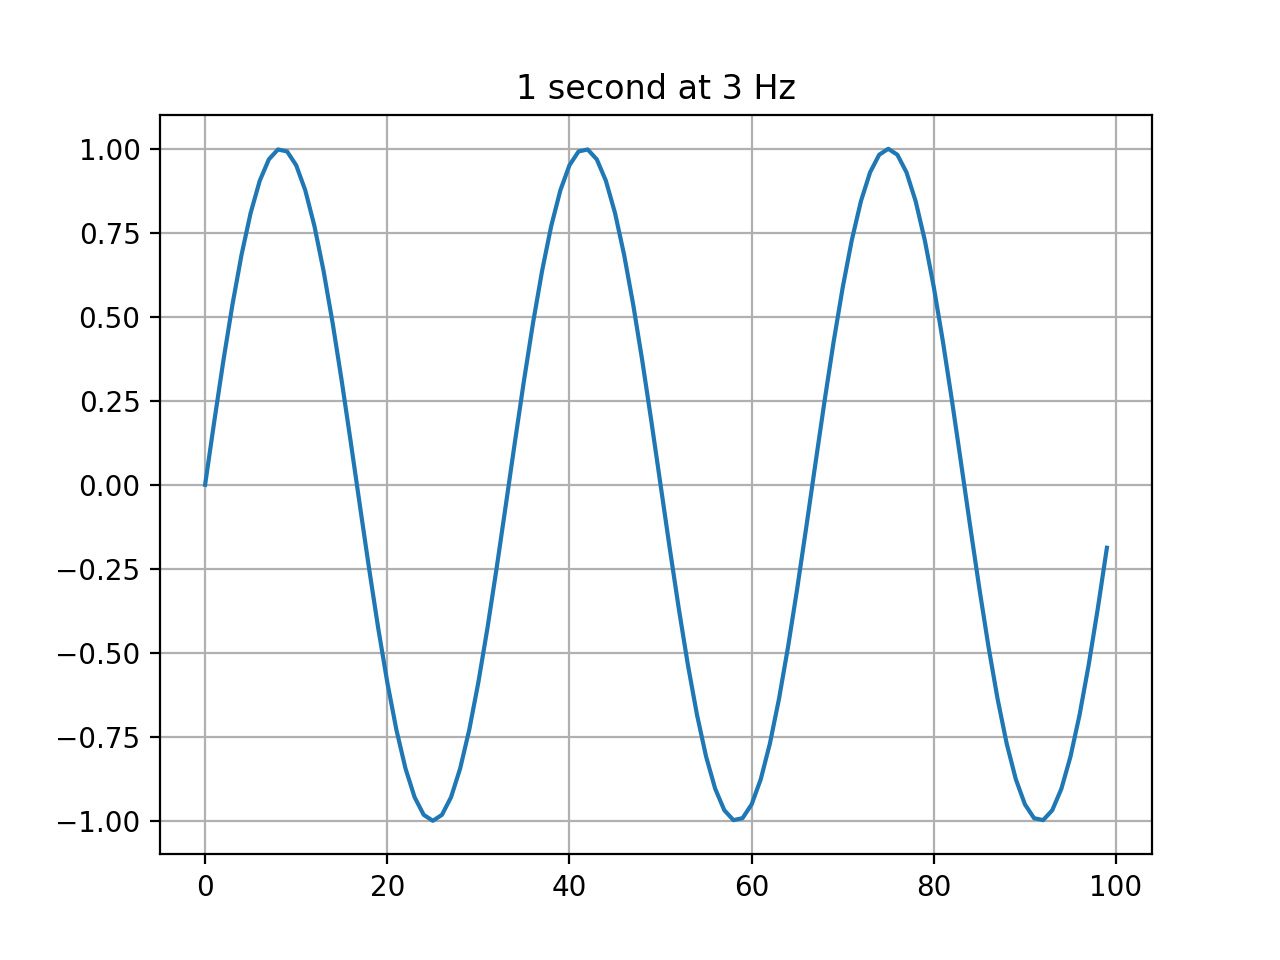
Drawing sine waves. The drawSine() and drawSine2() functions use the C++ std::sin() function to generate samples. These functions do not use a wavetable, so there will not be any interpolation or aliasing problems that may occur for wavetable oscillator classes that derive from Generator. Some examples:
import Nsound as ns

sr = 1000.0

g = ns.Generator(sr)

###########################################################################
# 3 Hz
a = ns.AudioStream(sr, 1)
a << g.drawSine(1.0, 3.0)

a.plot("3 Hz")

###########################################################################
# Dynamic Frequency
a = ns.AudioStream(sr, 1)
a << g.drawSine(1.0, g.drawLine(1.0, 0.0, 10.0))

a.plot("Dynamic Frequency")

###########################################################################
# Dynamic Phase
a = ns.AudioStream(sr, 1)
a << g.drawSine2(1.0, 3.0, g.drawLine(1.0, 0.0, 1.0))

a.plot("Dynamic Phase")


The Sine Generator
The Sine class is derived from Generator. Some of its documentation:
- Sine(sample_rate)
- Sine.generator(duration, frequency)
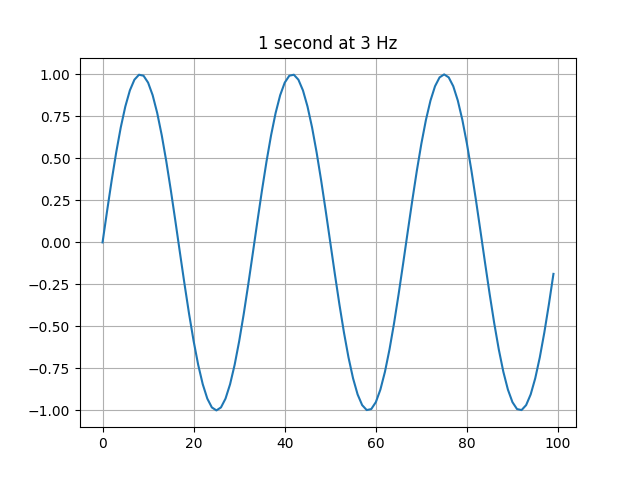
It inherits all the draw functions for convience. Lets generate a 3 Hz signal.
import Nsound as ns

s = ns.Sine(100.0)

b = ns.Buffer()
b << s.generate(1.0, 3.0)

b.plot("1 second at 3 Hz")
(Source code, png, hires.png, pdf)
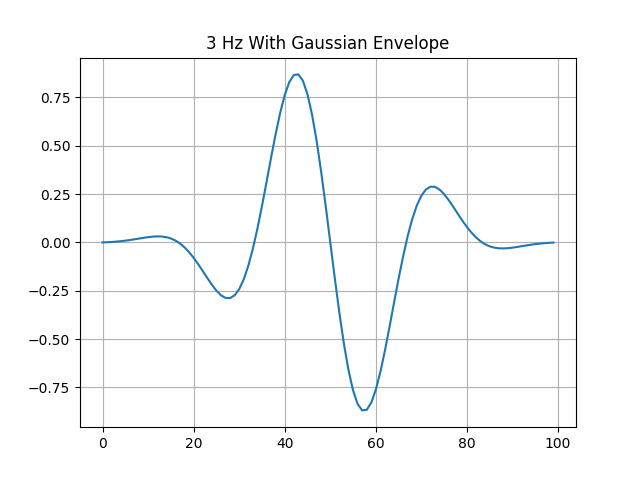
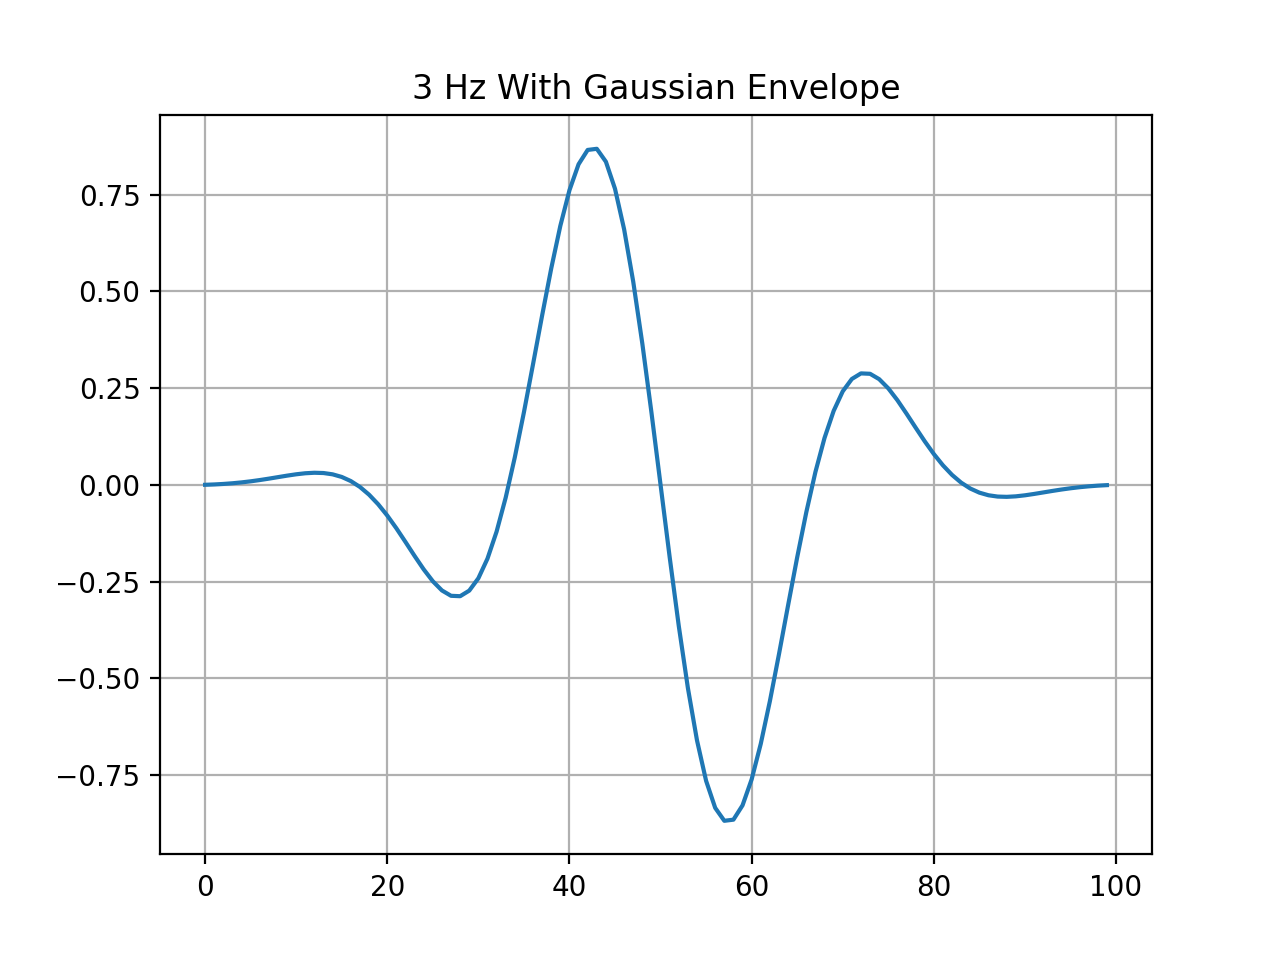
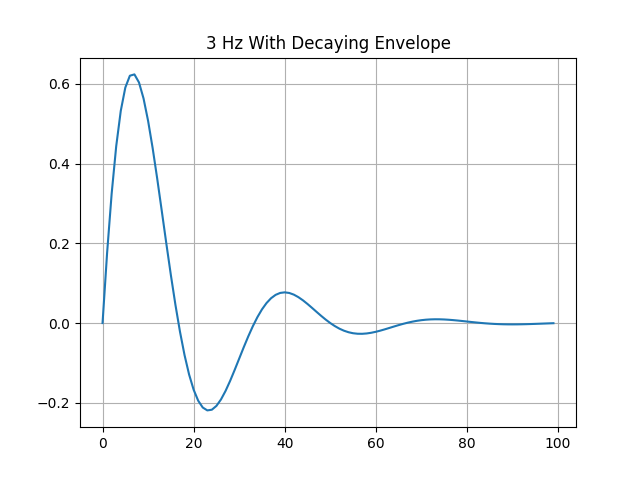
Now lets multiply the 3 Hz signal by Gaussian and decaying envelopes.
import Nsound as ns

s = ns.Sine(100.0)

g = ns.Buffer()
g << s.drawGaussian(1.0, 0.5, 0.15)

d = ns.Buffer()
d << s.drawDecay(1.0)

b = ns.Buffer()
b << s.generate(1.0, 3.0)

gauss = b * g
decay = b * d

gauss.plot("3 Hz With Gaussian Envelope")
decay.plot("3 Hz With Decaying Envelope")


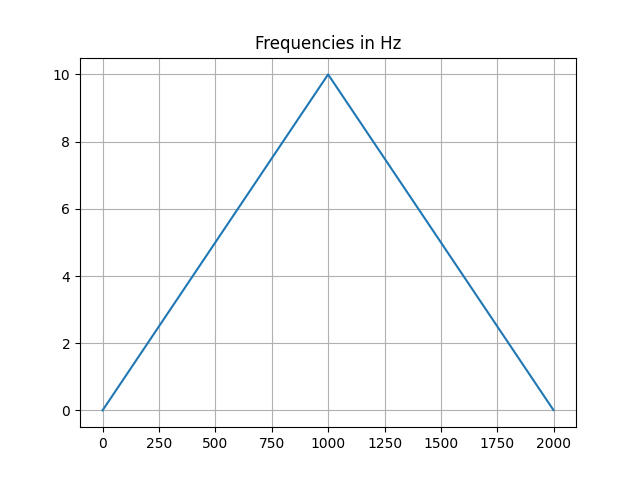
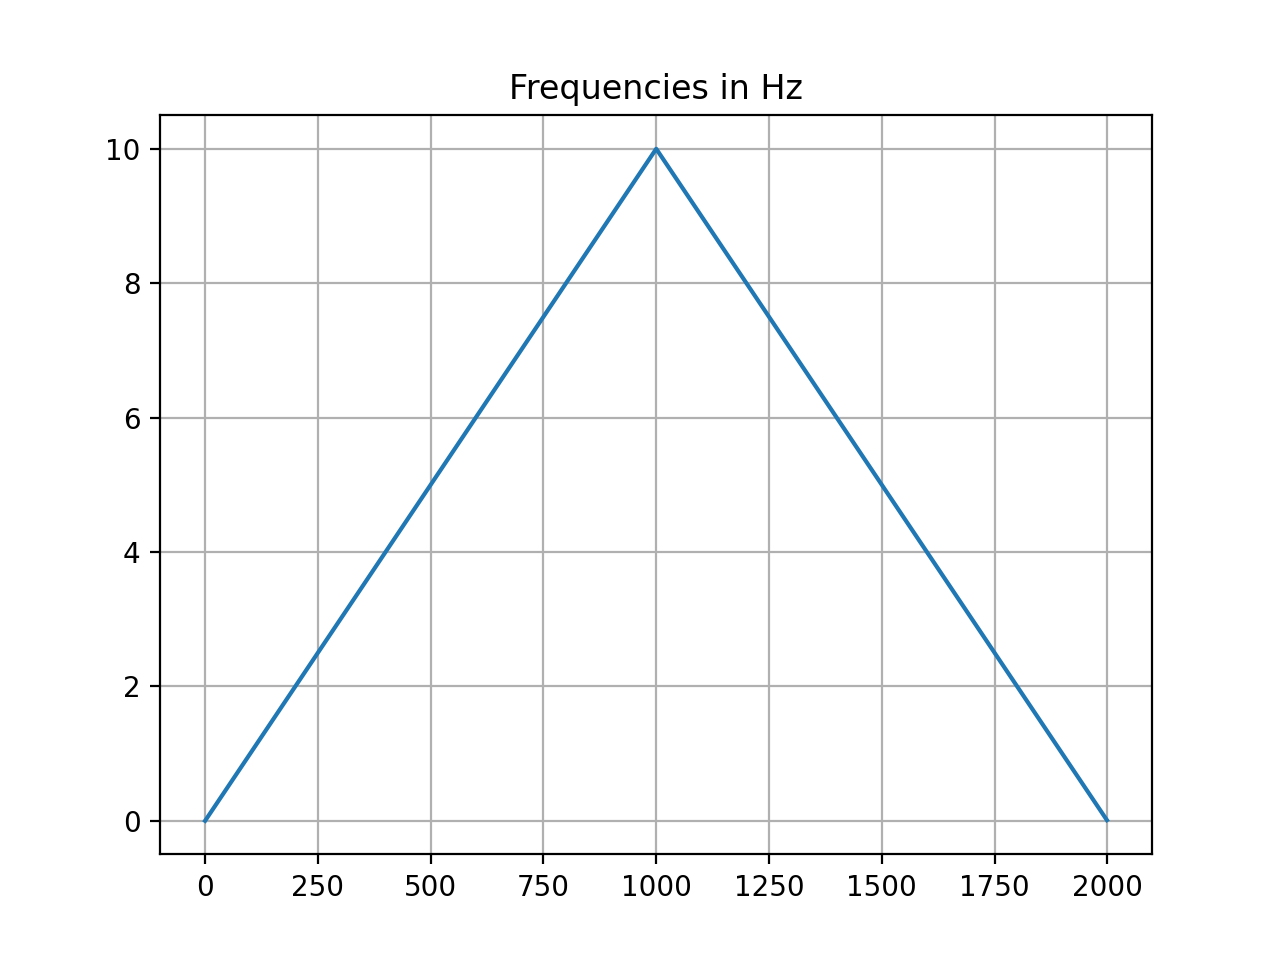
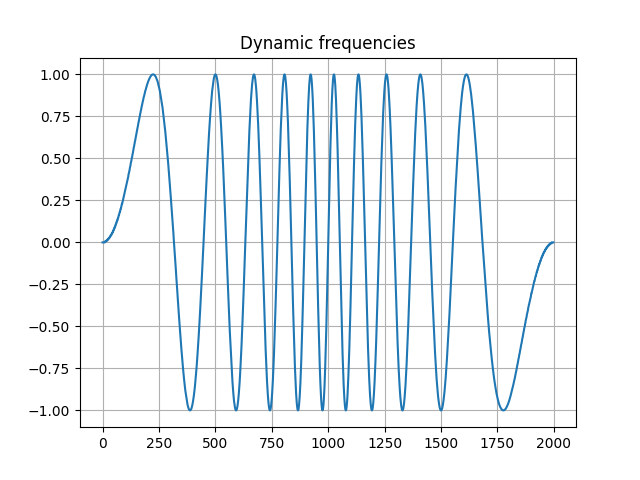
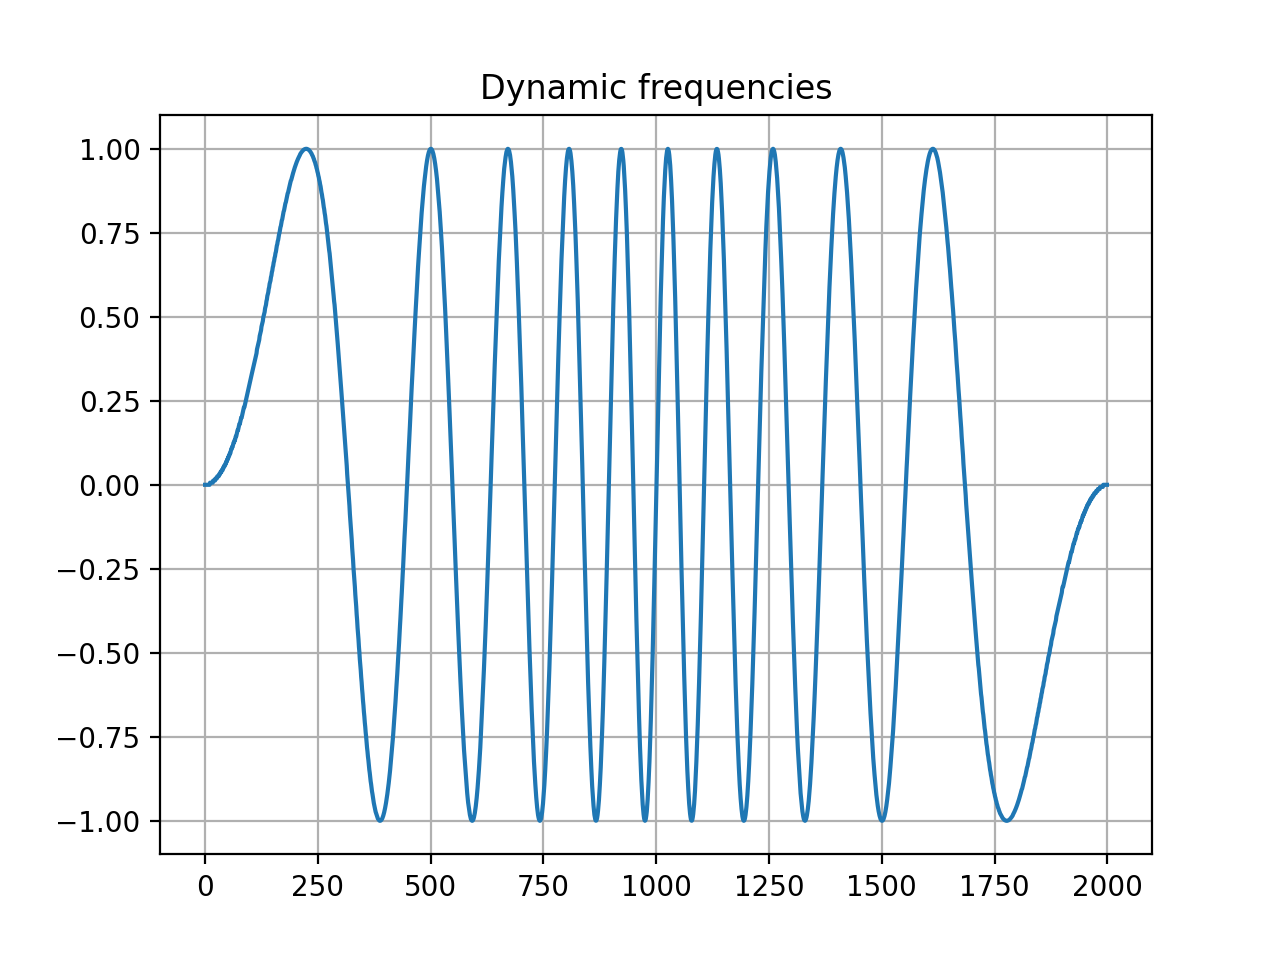
The Generator class also allow dynamically changing frequencies. Simply create a Buffer to hold frequency values and pass the Buffer to the generate function. Below the frequency will change from 1 to 10 back to 1.
import Nsound as ns

s = ns.Sine(1000.0)

freqs = ns.Buffer()
freqs << s.drawLine(1.0,  0.0, 10.0) \
      << s.drawLine(1.0, 10.0,  0.0)

freqs.plot("Frequencies in Hz")

b = ns.Buffer()
b << s.generate(2.0, freqs)

b.plot("Dynamic frequencies")
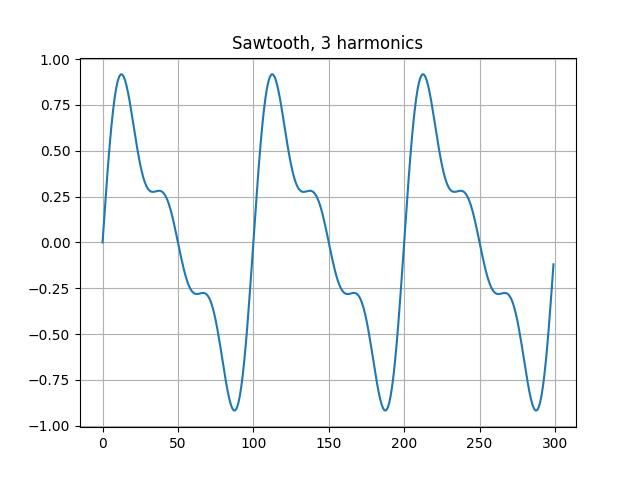
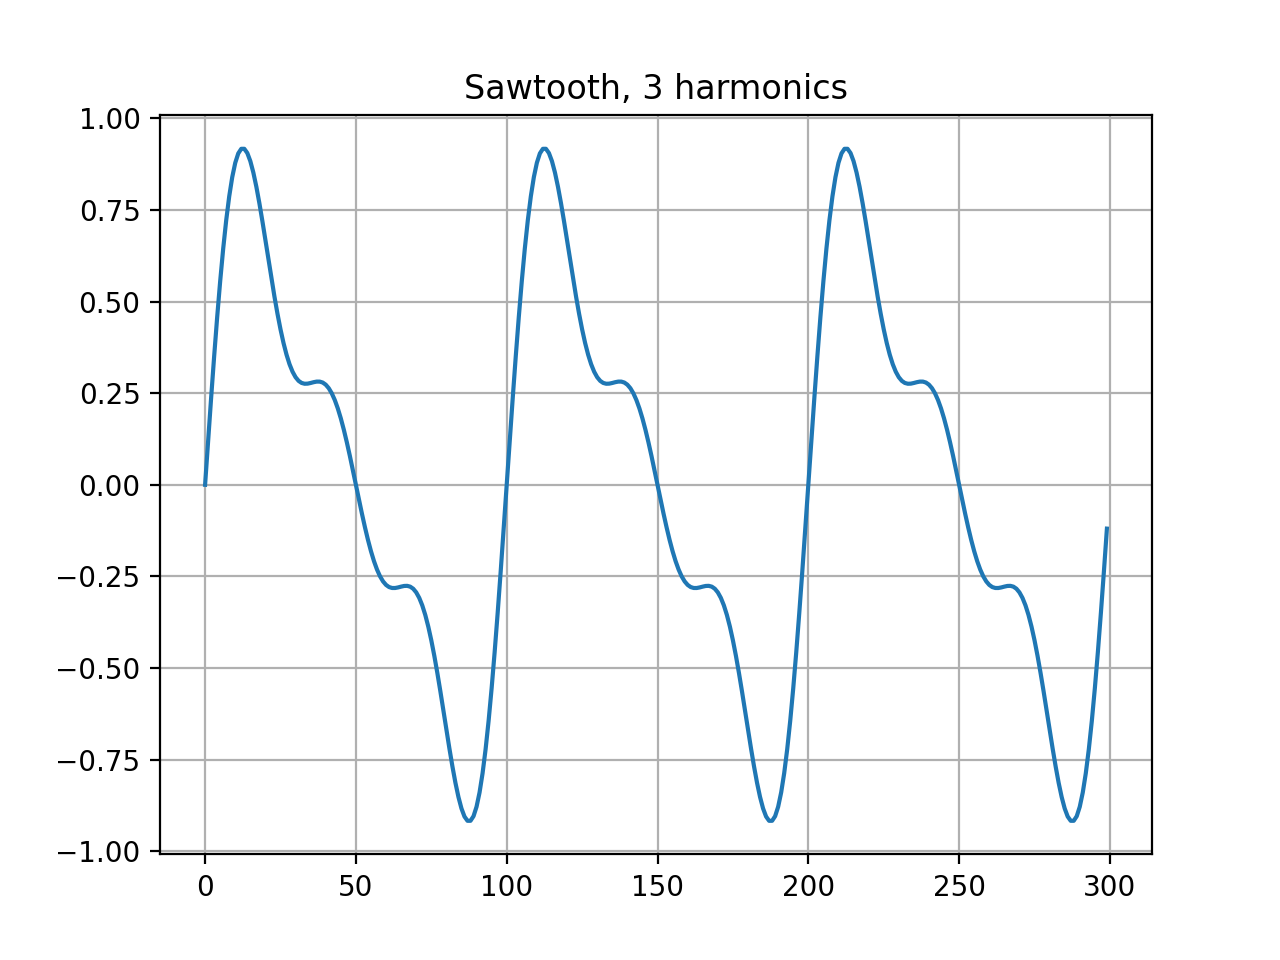
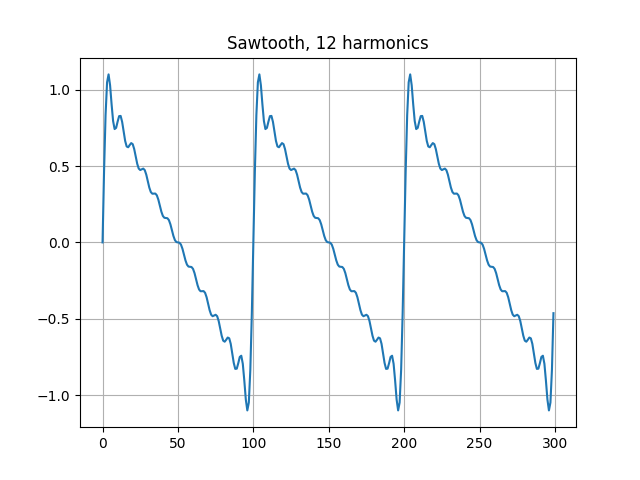
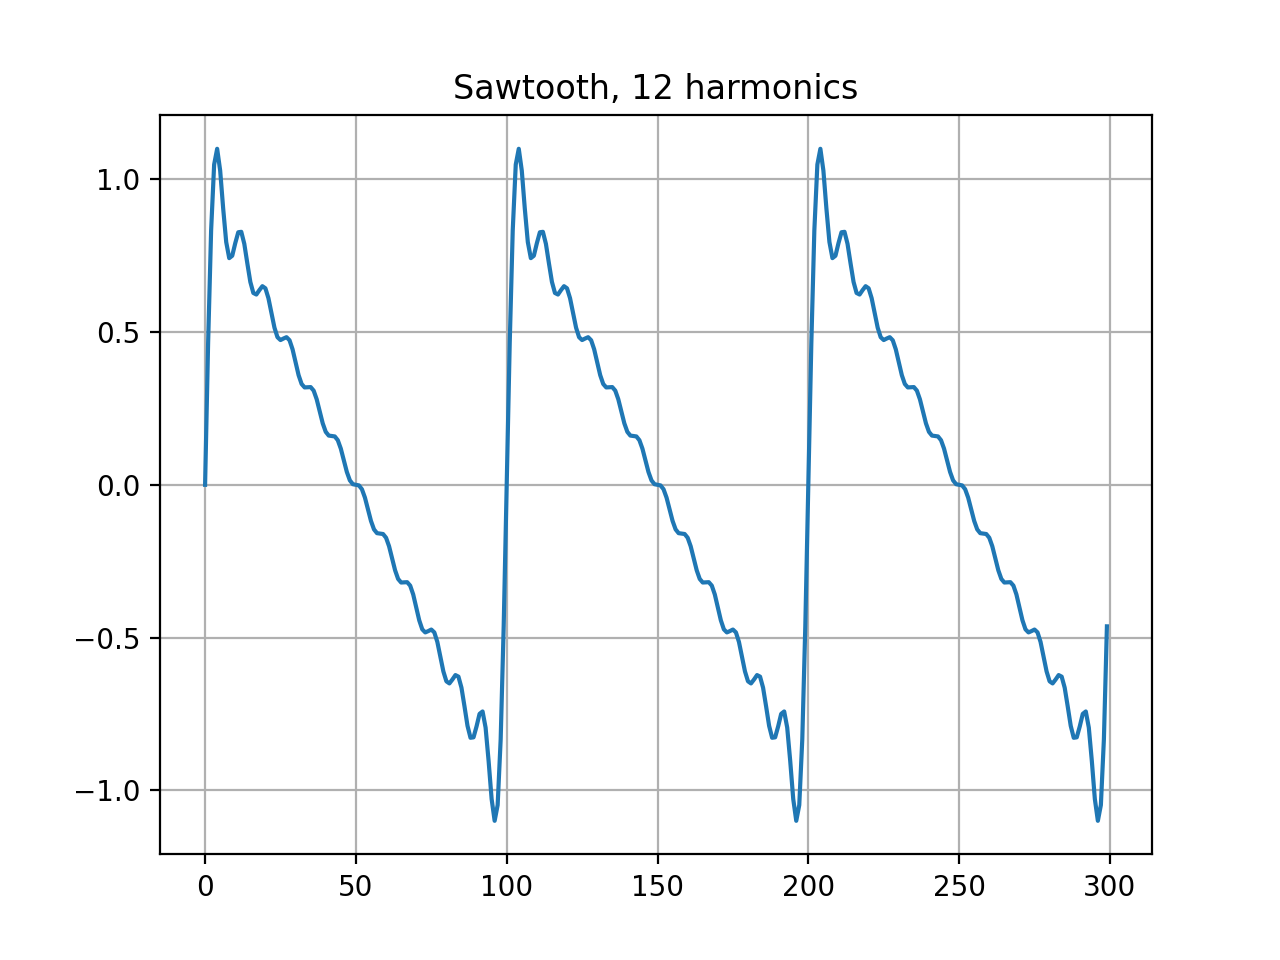
The Sawtooth Generator
As you would expect, the Sawtooth Generator draws sawtooths, with the specified number of harmonics.
- Sawtooth(sample_rate, n_harmonics)
- Sawtooth.generator(duration, frequency)
import Nsound as ns

saw = ns.Sawtooth(100, 3)

b = ns.Buffer()
b << saw.generate(3.0, 1.0)

b.plot("Sawtooth, 3 harmonics")

saw = ns.Sawtooth(100, 12)

b = ns.Buffer()
b << saw.generate(3.0, 1.0)

b.plot("Sawtooth, 12 harmonics")


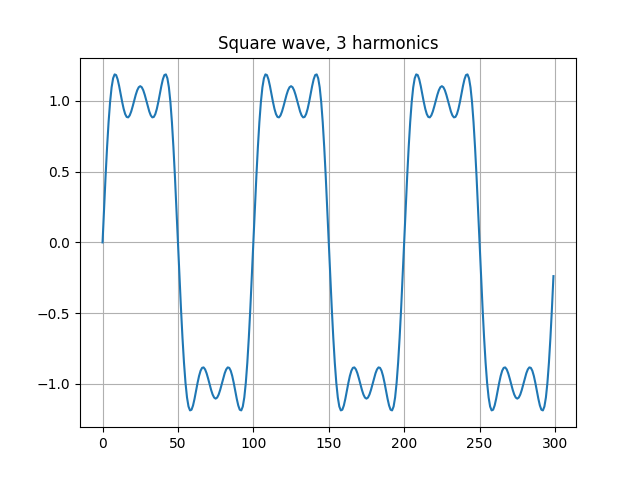
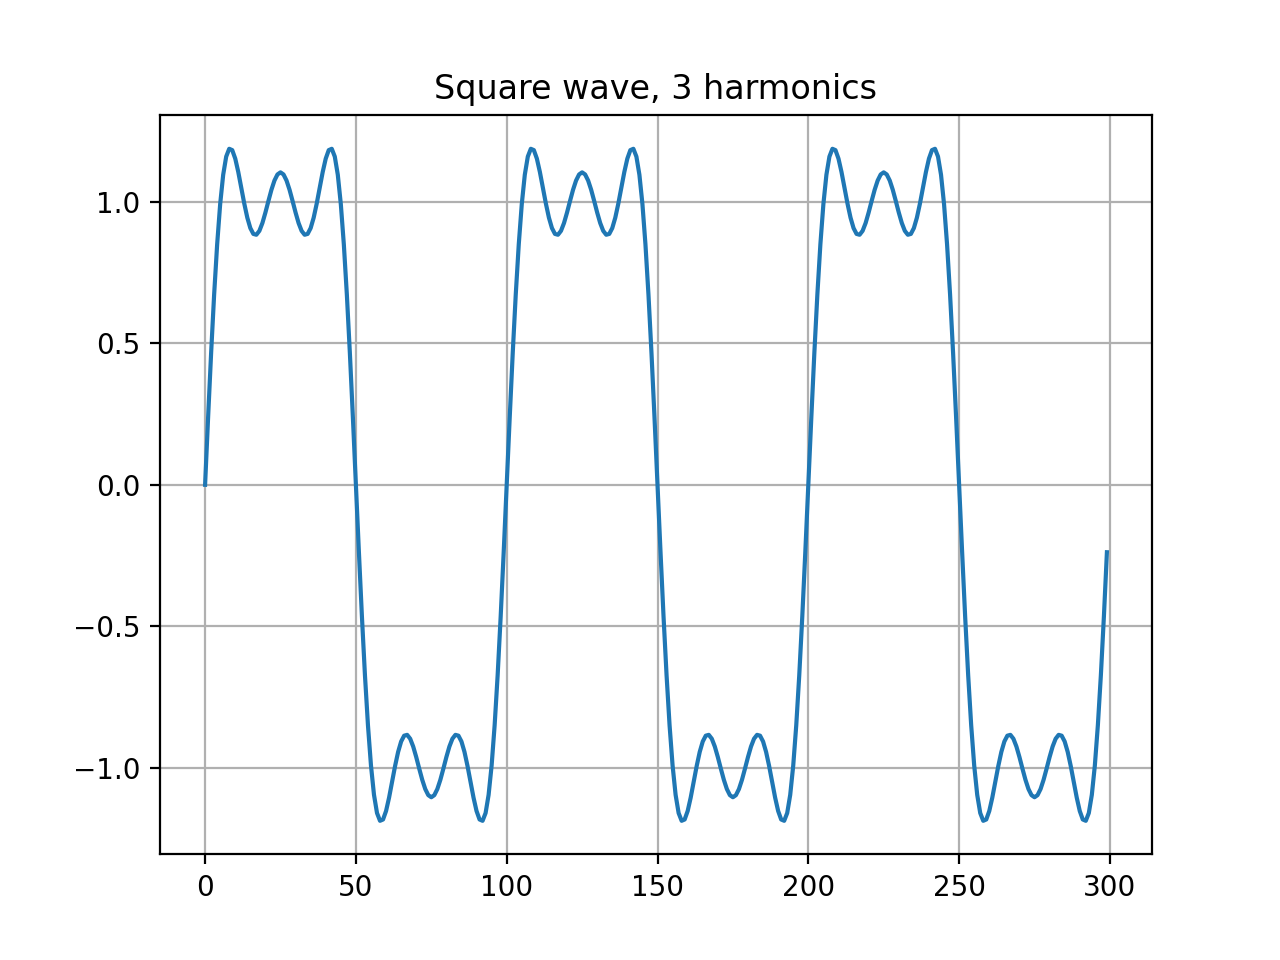
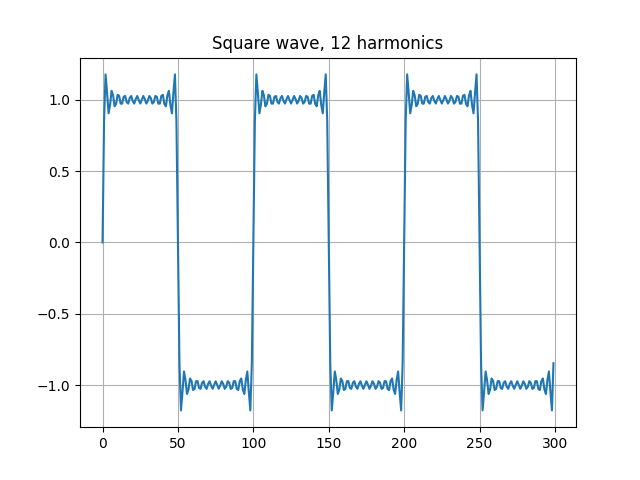
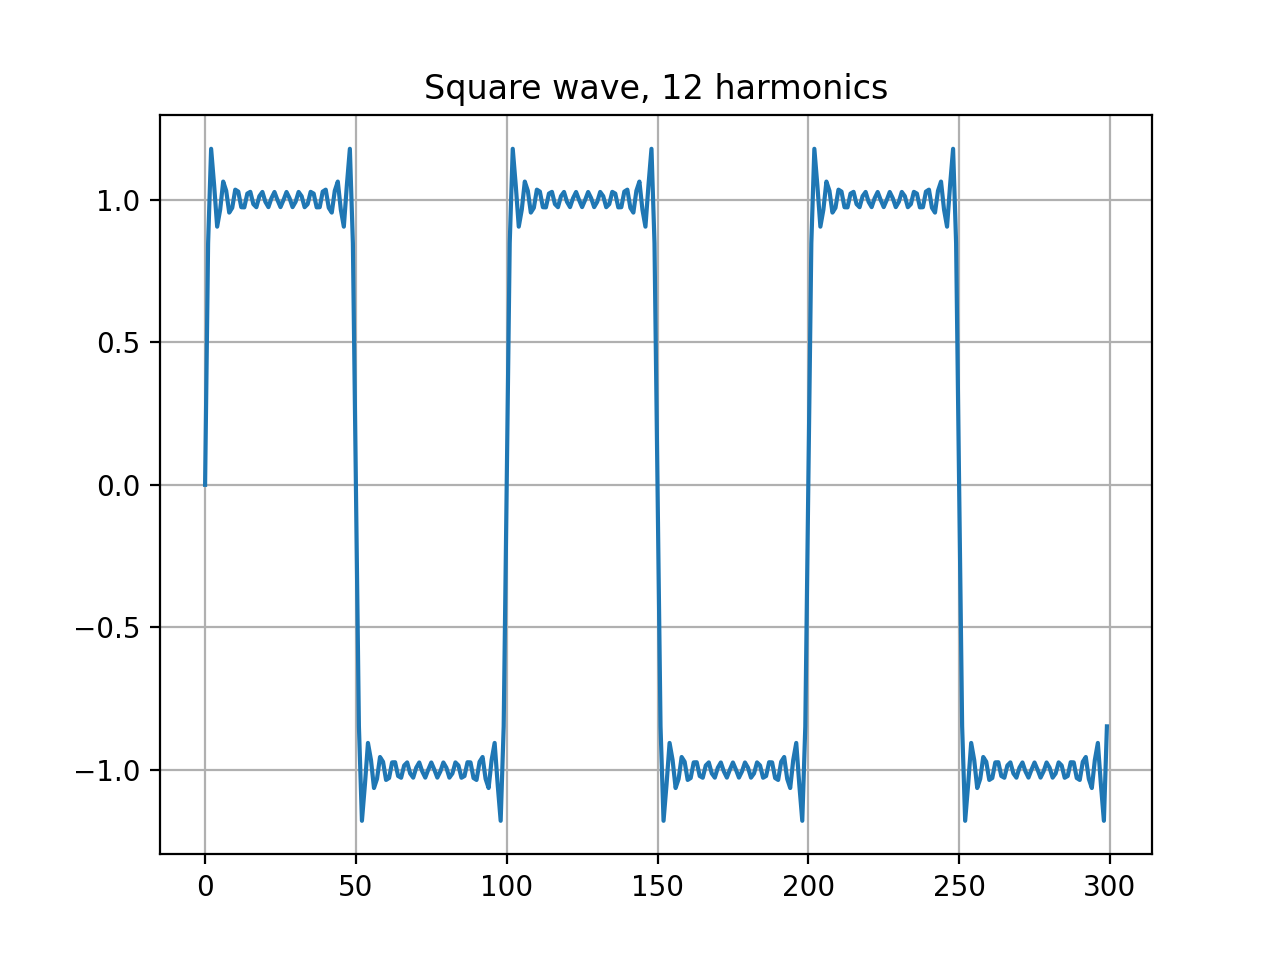
The Square Generator
As you would expect, the Square Generator draws square waves, with the specified number of harmonics.
- Square(sample_rate, n_harmonics)
- Square.generator(duration, frequency)
import Nsound as ns

square = ns.Square(100, 3)

b = ns.Buffer()
b << square.generate(3.0, 1.0)

b.plot("Square wave, 3 harmonics")

square = ns.Square(100, 12)

b = ns.Buffer()
b << square.generate(3.0, 1.0)

b.plot("Square wave, 12 harmonics")
