Plotting
Nsound uses the wonderful Matplotlib package for making plots. To do this, a simple C++ class called Plotter wraps some of the Python C-API so that the C++ libNsound library can make calls into the Matplotlib classes to make plots.

In the Python module, the Plotter class make calls into the Python Matplotlib module.
If you are using the C++ library and the Matplotlib C-API was found, plotting will be enabled. If you are using the Python module and Matplotlib is installed, plotting will be enabled.
Note
Plots will not pop up by default with the C++ or non-interactive Python code. For C++, a call to Plotter::show() will render the plots to the screen. With the Python module, a call to either matplotlib.pylab.show() or Nsound.Plotter.show() will display the plots.
Note
You will not see calls to Plotter.show() in this User’s Guide, the plots are generated with inline Python code and are saved to disk.
Note
On MacOSX, if you are using the MacPorts package manager to install Python, Numpy, and Matplotlib in /opt/local, you will need to set the default Matplotlib backend. To do so edit the file ~/.matplotlib/matplotlibrc and add a line that reads “backend : MacOSX”.
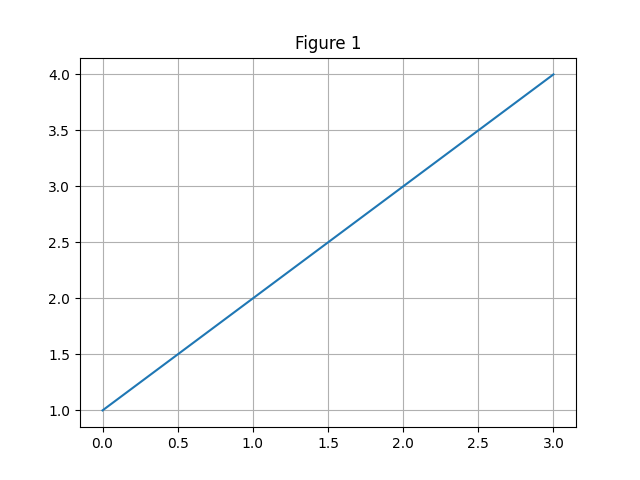
Once you start manipulating your Buffers and AudioStreams, it is easy to see the effect by plotting them:
import Nsound as ns
b = ns.Buffer()
b << 1 << 2 << 3 << 4
b.plot("Figure 1")
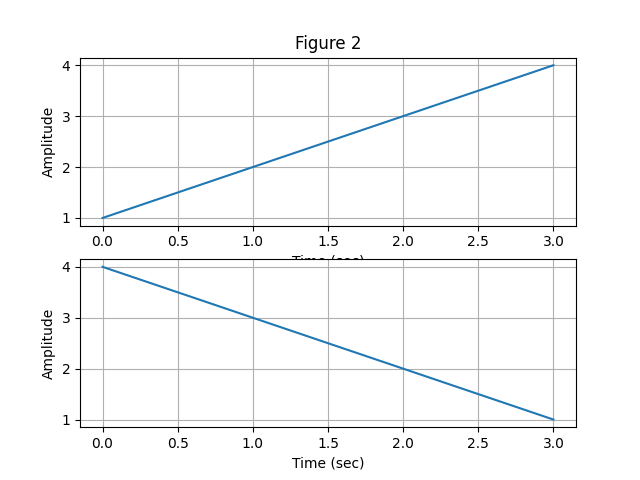
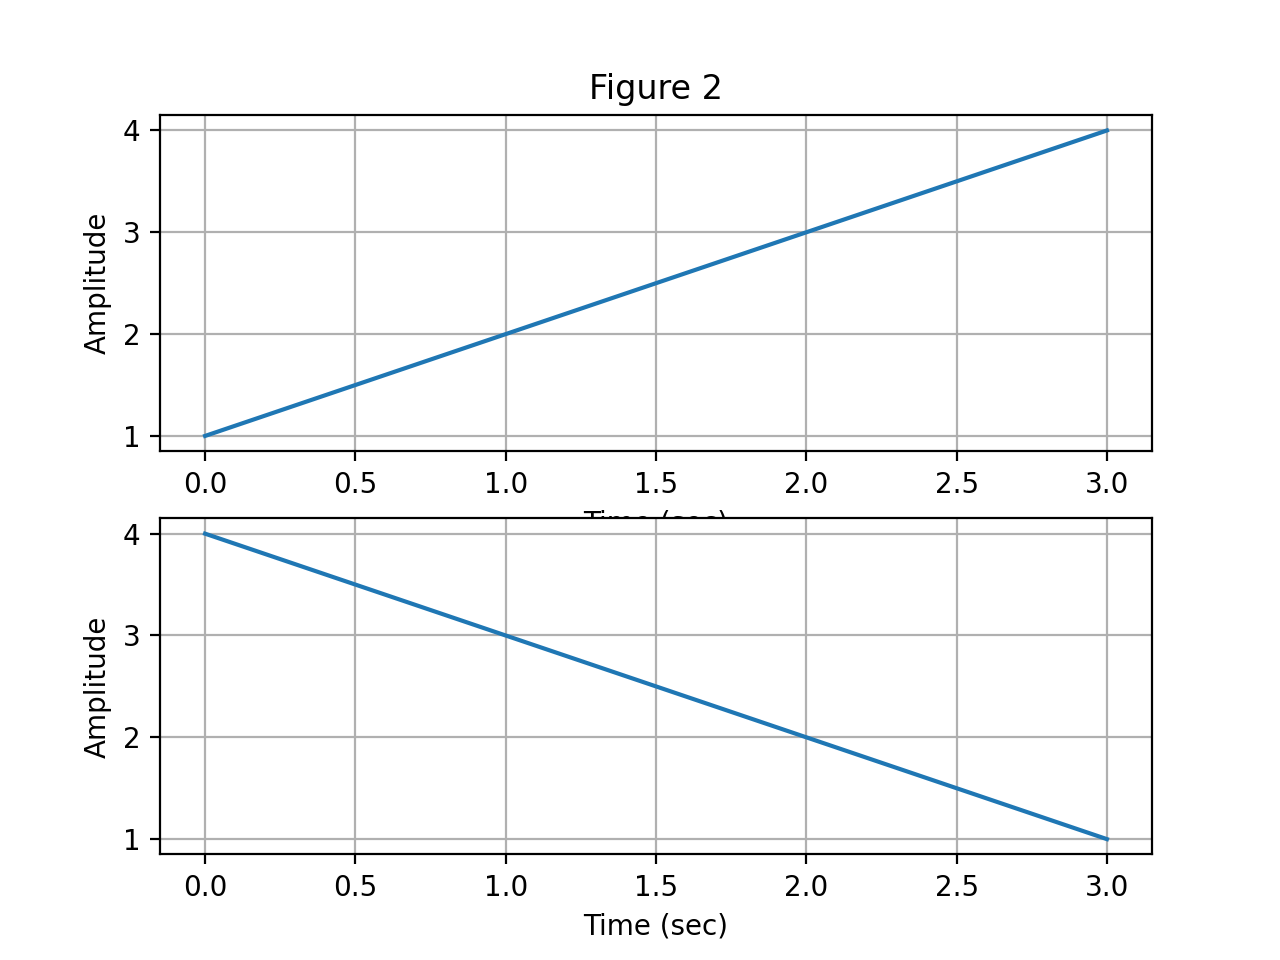
a = ns.AudioStream(1, 2)
a[0] = b
a[1] = b.getReverse()
a.plot("Figure 2")
# Your code needs to call the show()
# method to make the plots show up.
# ns.Plotter.show()
